





Week in Review: September 11, 2026
September 14, 2026
Overview
Markets ended the week lower as investors reacted to renewed Middle East fighting, August inflation data, and a further rise in Treasury yields, while looking ahead to this week’s Federal Reserve meeting.
Middle East tension intensified following reports that Iran fired ballistic missiles at US naval vessels and the US responded by sinking multiple Iranian oil tankers. In addition, a new front in the fighting emerged as Iranian-backed Houthi rebels based in Yemen attacked a key Saudi oil pipeline forcing its closure. The collective actions helped drive US oil prices back above $100/barrel for the first time since May while adding to broader inflationary concerns.
Pressured by higher energy prices, August inflation data, a disappointing Treasury buyback, and growing expectations of a Fed rate hike, interest rates increased significantly over the course of the week. At the short-end of the curve, the 2-year Treasury rose 0.26% reflecting increased odds of a Fed rate hike this week. Further out, the 10-Year Treasury yield rose 0.18% as it neared the psychologically important level of 5%.
Inflation took center stage with the release of the consumer price index (CPI). On a headline basis, CPI rose 0.4% in August, its largest monthly gain since May. A 3.9% increase in gasoline prices accounted for 1/3 of the overall monthly increase. Compared to a year ago, headline CPI increased 3.4%, the same pace recorded in July. Core CPI, excluding food and energy prices, rose 0.3% for the month and 2.4% from a year ago. During the week, diesel prices surpassed $6/gallon for the first time ever, propelled by a confluence of factors including, fighting in the Middle East, and Ukrainian attacks on Russian oil refineries. Given the importance of diesel to the transportation industry, record high prices will likely continue to put upward pressure on inflation. Following the release of the CPI data, market expectations for a September rate hike jumped to 86%.
Though it didn’t feature quite as prominently in the headlines, trade relations between the US and Canada continued to deteriorate as Canadian retaliatory tariffs of 15-50% went into effect on $20B of US imports. Canada’s tariffs were a response to 50% tariffs the US levied on ~$20B of Canadian goods in late August. Though the absolute amount of goods and services subject to the new tariffs are relatively small compared to the total amount of trade between the two countries, the new tariffs highlight the deteriorating trade relations between the historically close allies.
The Details
Equities
Equity markets were soft again last week, with the S&P 500 down 0.8% and the Nasdaq down 0.7%. Continuing a trend from recent weeks, the broader S&P Equal Weight and Russell 2000 were even weaker, down 1.9% and 2.4%, respectively. Further, under the surface of the S&P, the average and median stock were down over 2% on the week.
While the S&P 500 index level has been rather quiescent on the surface, there has been noteworthy volatility among the index constituents over recent months. At 7,664, the S&P is down only 2% from its all-time high on August 13th. However, the median stock is down 15% from its 52-week high, which is representative of sagging market breadth over recent weeks. Weakening of the average stock tend to catch-up with the index at some point, resolving with eventual index level pressure. With September typically the worst month of the year, uncertainty about monetary policy and mid-term elections coming into view, some choppiness is a reasonable expectation for the near-term.
With interest rates front and center over recent weeks, it is worth reviewing implications for equity markets. As a corporate finance 101 refresher, all asset prices are ultimately impacted by the level of the risk-free rate. It sets the risk-free return expectation over a long-term investment horizon, upon which risk premiums are added to determine valuations for various cash flowing assets. The 10-year treasury yield is often cited as the benchmark risk-free rate. With 10-year yields marching higher, it is natural to wonder what it means for equity markets. In short, it depends! Theoretically, stocks with higher valuations and distant expected cash flow suffer more in a rising rate environment, as the deferred value realization is subject to a longer discount period. Companies heavily reliant on debt markets are also more negatively impacted. Conversely, a lower valuation company with more of its value accounted for by near-term cash flows is less impacted by a higher cost of capital.
At the index level, valuations are most impacted at the extremes; high price-to-earnings (P/E) ratios in a low-rate environment and low P/Es when rates are high. In the middle of the rate range, P/Es seem more dependent on underlying fundamentals and cycle views. Data over the last 35 years depicted below illustrates these tendencies. While it may seem counterintuitive that PEs actually rise as yields rise from low-single digits to mid-single digits, the higher yields in this range are often associated with more robust periods of economic activity and profit growth and thus tend to correlate with higher valuations.
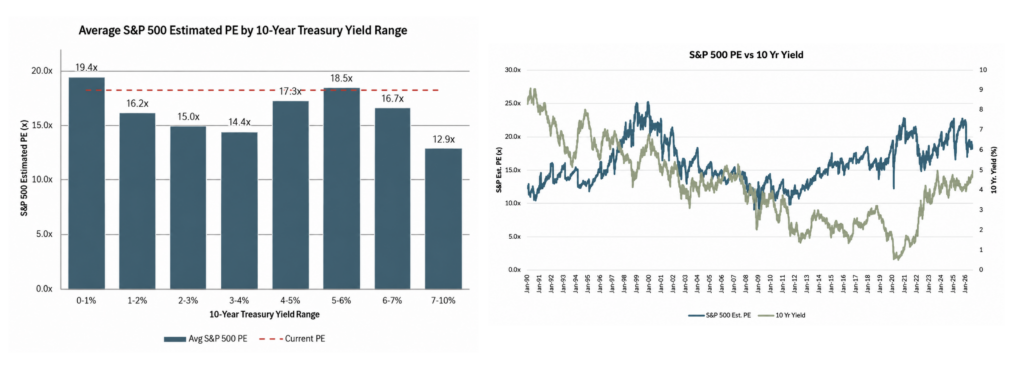
Source: Bloomberg
Note: Based on data from January 1990 through September 11, 2026
Long rates are currently rising and nearing or breaching their highest levels in two decades. It is occurring against a backdrop of inflation that has been above Fed targets for 65 straight months. Knowing P/Es were sub 10x during the last problematic inflation period in the 1970s, investors rightly scrutinize rising yields against relatively high current P/Es. While investor indigestion is to be expected, it is important to remember inflation ranged between 5% and 15% during the 1970s, vs mid-3%s currently. With elevated oil prices amidst Middle East tensions, the current episode rhymes with the benchmark inflationary period, but the scale of the problem is currently quite different. Strong profit growth and empirical data over the last 35 years suggest P/Es around the current level are justifiable. Still, to the extent higher yields are a reflection of broader fiscal or monetary concerns, the business cycle cannot outrun those problems indefinitely.
Fixed Income
The shorter week didn’t slow the continued upward pressure on yields across the bond markets. The long end of the Treasury curve has dominated headlines recently, but this week focus turned to the 10-Year Treasury, the most widely watched rate in the market, as it pushed toward 5%. The week started at 4.78% and closed at 4.95%.
Five percent on the 10-year Treasury is both a psychologically significant number and a market driver. It is a foundational rate against which a wide swath of borrowing costs are benchmarked. In addition, 5% is seen as substantial yield on “risk-free” money, heightening competition with other asset classes. Because of its rarity over the last 20 years, its psychological and digestible level, and the yield opportunity it creates, 5% can become a catalyst for portfolio shifts, economic policy responses, and a broad market recalibration. There is real momentum behind the move toward 5% and Friday’s CPI print did little to interrupt it.
A counter to this market pressure has been the “Bessent put”, an attempt by the US Treasury to use buybacks to add stability to pricing on the long end of the yield curve. Announced a few weeks ago, the Treasury enlarged the size of the existing program. The first buyback happened this week with a stated maximum of $6B, ultimately clearing $5.2B of long-dated off-the-run treasuries, triple the previous level. Still, it was less than market participants expected or found meaningful. The announced size of the buyback kickstarted the week’s sell-off, moving 10- and 30- year rates higher.
The rate pressure in the U.S. this past week was in large part a response to the resumed fighting in the Middle East. However, this is not just a domestic concern. Globally, rates are rising. The European Central Bank (ECB) raised rates this week, a move characterized by President Lagarde as a “no brainer”, and German bunds rose with it. Importantly, forecasts for an additional hike this year and more into 2027 were key to the movement. Markets increasingly see the ECB as taking the lead in countering inflation pressures, while the Bank of England (BOE) and the Federal Reserve appear likely to move more slowly on raising rates, if they move at all. The Bank of Japan (BOJ) remains a key story, as its policy decisions can influence the yen, global capital flows, and demand for U.S. Treasuries. Several board members signaled that multiple hikes are on the table, with one even entertaining a 50-basis-point (0.50%) hike at some point. They meet on September 18th and are also expected to hike – arguably another “no brainer”. The questions in Japan and globally are less about whether to raise rates, but rather the pace, frequency and size of hikes into the future.
The municipal market had a week of underperformance versus Treasuries. Overall, the market responded to both August’s record supply, which ate up a fair amount of cash, and the broader cheapening across the bond markets. The Bloomberg AAA Muni curve placed the 30-year yield at 4.89%, its highest level since 2011, and the equivalent of a 7.76% taxable yield for investors in the top federal bracket. Two things are true about the current rate environment: yields are rising at a time of genuine inflation pressure, and yields are at levels historically viewed as opportunities, attracting both traditional and nontraditional buyers.
The week ahead will center around the Federal Reserve’s meeting and its willingness to respond with a rate hike. Currently, market expectations for a rate hike stand at ~86%. Yet whether the Fed ultimately hikes or holds, the bond market may still find itself testing a 5% 10-year Treasury as investors continue to grapple with inflation, fiscal concerns, elevated energy prices, and rising global rates.
Trust, estate planning, insurance, and investment products are not a deposit, not FDIC insured, not insured by any federal government agency, not guaranteed, subject to investment risks, including possible loss of the principal amount invested and may go down in value. Any information and research contained herein do not represent a recommendation of investment advice to buy or sell stocks or any financial instrument nor is it intended as an endorsement of any security or investment, and it does not constitute an offer or solicitation to buy or sell any securities or investment services. This content is for informational purposes only and does not constitute legal or tax advice. Please consult your legal or tax advisor for specific guidance tailored to your situation. First Western Trust Bank cannot provide tax advice.

Insights
September 2026 Market Commentary
The dog days of summer. The term conjures images of hot, oppressive days that sap one’s energy, creating a sense […]
Learn more
Week in Review: September 11, 2026
Overview Markets ended the week lower as investors reacted to renewed Middle East fighting, August inflation data, and a further rise in Treasury yie
Learn more
Week in Review: September 4, 2026
Recap & Commentary Markets ended the week effectively unchanged. After coming off a relatively quiet August, markets will now turn […]
Learn more
The Return of Yield
The Fixed Income Fix by Marian Cieslak After years of near-zero rates, today’s higher yields are creating meaningful opportunities for […]
Learn more
Why Every Family Should Consider a Letter of Wishes
A well-crafted trust can help preserve wealth, protect assets, and provide clarity for future generations. Yet even the most comprehensive […]
Learn more
Ready to learn more?
Let’s have a conversation.
Embark on a banking experience tailored to your distinct path, focused on achieving personal and business financial prosperity.