


2021 Economic Outlook: a Global View
February 12, 2021
The impact of the COVID-19 pandemic on the economic markets was felt around the world. Global markets experienced some of the worst recessionary activity in modern times, prompting government intervention to lessen the impacts on small businesses and record unemployment claims. As the world slowly begins to recover, we’ll start to see the results of significant disparities in the speed of recovery between various countries and markets.
In January of 2021, First Western Trust Bank hosted a webinar on the economic outlook around the world, including this summary of global markets from David Stern, Director of Investment Research.
Global PMIs

On the chart above is a heat map of global purchasing managers index (PMI) data, which is a survey-based index. Shown here is the composite number, capturing both the manufacturing and services sectors for various countries and regions around the globe.
Values above 50 are indicative of economic growth, whereas those below 50 are indicative of economic contraction. Numbers in the low-40s are typically associated with recessionary periods. Moving from right to left, starting in December of 2019, the global economy entered 2020 in good shape. All of the values in January of 2020 were above 50, indicating broad economic growth across these countries and regions.
As we progressed into the first quarter, economic activity came to a virtual halt, almost overnight, in the face of the rapidly spreading coronavirus. In April 2020, indices around the world dipped into the teens and even single digits — a remarkably low level, given that numbers in the low-40s are considered recessionary.
As we moved through the second quarter and into the third, the numbers began to recover. By July, most readings were back in the green (above 50). Of late, however, we have seen a slowing of this recovery trend. Specifically, in developed markets, we have seen some moderation in the face of a second wave of viruses and as countries take steps to stem the resurgence of the pandemic.
As we enter 2021, the picture is mixed. Emerging markets are doing a little bit better than developed markets, but we anticipate, over the course of 2021, that developed markets will again return to growth as we continue to rein in and get a handle on the coronavirus.
Global GDP
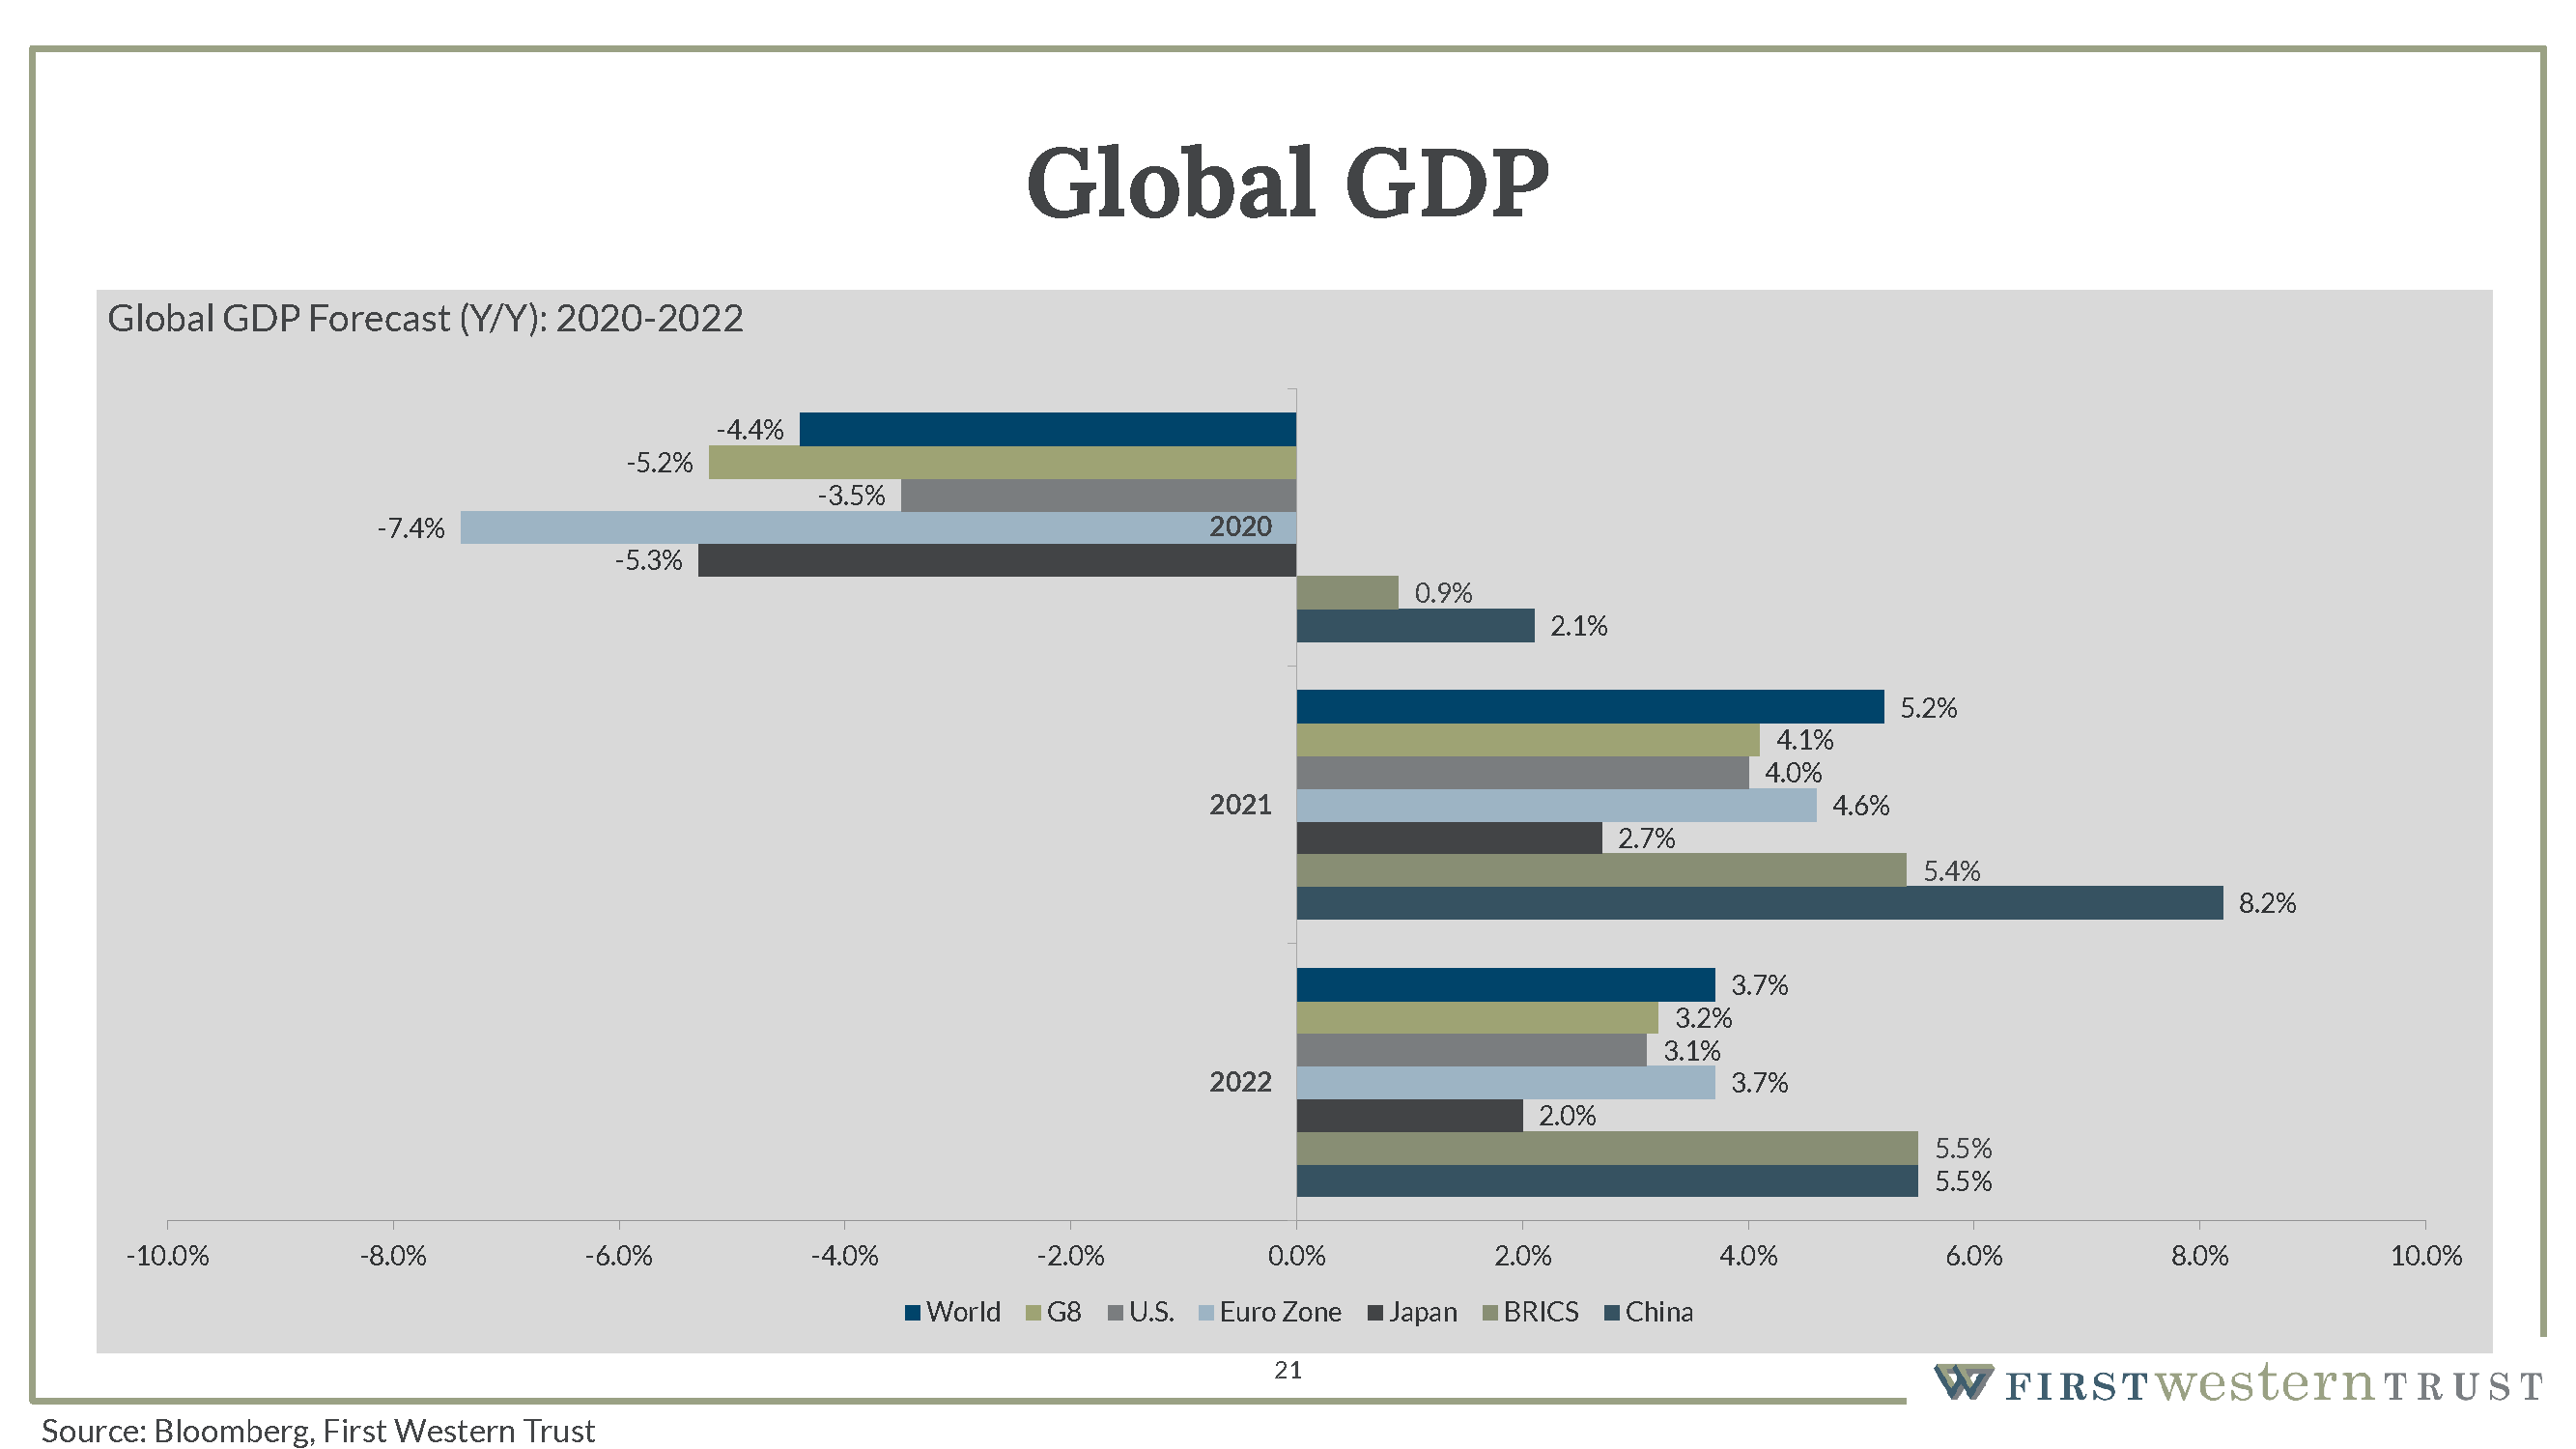
Obviously, 2020 was a very difficult year across the board. Global economic growth is forecasted to decline approximately 4.5 percent, led by the Eurozone falling close to 7.5 percent. Relatively speaking the U.S. has fared better, only dropping 3.5 percent.
The notable outlier on this chart is China, which experienced an increase in GDP growth of 2.3%, based on recently released data.
Relative to the rest of the world, that’s a good number — here in the US, we would be happy to be able to report 2.3 percent growth for 2020. In the context of Chinese history, however, that number is very low. In fact, it’s the weakest annual growth China has reported since 1976 when China’s economy contracted 1.5 percent growth. For additional context, during the financial crisis of 2008 and 2009, China still managed to report growth of 9.5 percent. Growth of 2.3 percent looks positive compared to the rest of the world, but on the ground, China is experiencing the same recessionary effects as the rest of the world.
We expect a healthy rebound in 2021, as economic activity recovers, but it’s important to think of that in terms of a rebound rather than a new, sustainable higher run rate. That’s reflected in the 2022 projections, where we’re likely to see more moderation. We don’t see anything afoot right now that points to a structural rebasing to a higher, sustainable level of economic growth.
Global Yields
In our other discussions of equity markets, we touched on lower yields and the implications thereof. That phenomenon has not been unique to the U.S.

On this chart are the yields on 10-year bonds for various countries in Europe. There’s been a steady deceleration or reduction in those yields over time — Germany and France both have negative yields on 10-year bonds, while 10-year yields in France and Italy are approaching zero. At the short end of the curve, the yield on each of these counties’ two-year debt is negative. Even Greece, which was teetering on the brink of insolvency during the European debt crisis in 2012/13, and whose yields spiked to nearly 35%, has seen its government yields plummet. Today, both its 10-year and two-year debt, yields less than comparable U.S. bonds. In fact, similar to other European debt, yields on two-year Greek bonds are also in negative territory.
Global Debt

This chart captures the absolute amount of negative-yielding debt across the globe. At the end of 2020, we reached a new record high of about $18 trillion. As rates at the longer end of the curve begin to increase and, in some countries, move back into positive territory, this aggregate global number will decrease.
It’s important to remember that the market has the greatest influence on yields at the long end of the curve, whereas central bank activity and monetary policy has a greater influence on the short end of the curve. With the expectation of accelerating economic growth, we may see this number moderate in 2021, but we don’t expect a precipitous decline simply because of the demonstrated commitment by global central banks to keeping rates very low.
International Equity Performance

This succinctly captures the effect that lower interest rates have had on the global equity markets. What this graph shows is the price performance of the MSCI All Cap World Index, juxtaposed with the yield on the Global Aggregate Bond Index. The MSCI All Cap World Index is an index that reflects 23 developed markets and 27 emerging markets, for a total of about 85% of the global equity investable opportunity set. The Global Aggregate Bond Index, is a very broad measure of the global bond market.
The left vertical axis depicts the price performance of the ACWI index (in blue), while the right vertical axis shows the yield on the global aggregate bond index (in green). While the correlation is not one, there is a very clear relationship between the decline in global yields and the simultaneous increase in global equities.
Looking Forward
Frankly, many of us in the financial sector were surprised by the strong returns we saw both domestically and internationally. The fourth quarter showed especially strong returns, carrying positive momentum into 2021.
Going forward, we expect to see a continuation of many of the trends we saw at the end of 2020:
- Continued recovery with above-average GDP growth in 2021
- Varied inflation during the recovery phase, but settling to pre-COVID levels in the second half of 2021
- Short-term interest rates will likely remain low in line with guidance from the Federal Reserve, resulting in a continued “steep” yield curve
- Equity earnings will follow a reemergence path, likely reaching pre-COVID levels by the first half of 2022
The main focus of 2021 will be vaccine distribution both at home and abroad, which will in turn allow for the reopening of the economy and an increase in GDP growth. Yields will likely remain low, thanks to the commitment of central banks to keep interest rates low, which provides a positive backdrop for international equity markets
In this complicated financial environment, it’s important to have a financial advisor you can trust. At First Western Trust Bank, we’ve kept a close watch on the performance of global markets and the implications for our clients’ short- and long-term financial goals. Going forward, we’ll take a holistic approach to your finances, values, and priorities. If you’re ready to build a financial plan that’s uniquely tailored to your needs, get in touch with First Western today.
Investment and insurance products and services are not a deposit, are not FDIC insured, are not insured by any federal government agency, are not guaranteed by the bank and may go down in value. Opinions and estimates offered constitute our judgment and are subject to change without notice, as are statements of financial market trends, which are based on current market conditions. This material is not intended as an offer or solicitation for the purchase or sale of any financial instrument. This material has been prepared for informational purposes only, and is not intended to provide, and should not be relied on for, accounting, legal or tax advice.

Insights
Week in Review: April 24, 2026
Recap & Commentary Markets ended the week with the S&P 500 at a new record high as the index extended […]
Learn more
Week in Review: April 17, 2026
Recap & Commentary Markets ended the week higher, with the S&P 500 recording its largest weekly gain in 11 months […]
Learn more
Week in Review: April 10, 2026
Recap & Commentary Markets enjoyed their second consecutive week of gains following an announced ceasefire between the US and Iran […]
Learn more
Week in Review: April 3, 2026
Recap & Commentary Markets rebounded during the holiday‑shortened week as easing treasury yields and hopes for a diplomatic off‑ramp in […]
Learn more
Week in Review: March 27, 2026
Recap & Commentary Markets ended the week lower as the fighting in the Middle East continued unabated. Early in the […]
Learn more
Ready to learn more?
Let’s have a conversation.
Embark on a banking experience tailored to your distinct path, focused on achieving personal and business financial prosperity.