


2021 Economic Outlook: Equity Markets
February 12, 2021
2020 was a difficult year for investors, although in the end, equity returns were quite strong for the full year. The economic halt prompted by the pandemic, which led to major downturns in almost all sectors, was followed by swift rebounds in many areas. As we put the year behind us, First Western Trust Bank’s Managing Director of Equity Strategies, Karen Post, summarized the state of the U.S. equity market and highlighted key trends heading into the new year during our 2021 Economic Outlook Webinar.
Stock Valuations
Most measures that investors use to gauge whether the stock market is cheap or expensive all pretty much show that the market is expensive. No doubt, there is a lot of good news already priced into the market, and it is a very valid point of concern for 2021. Given the elevated levels, we would expect to see valuation measures come down from current values over the course of the year.

The chart above shows the most common valuation measure: the S&P 500 Forward 12-Month P/E ratio. Simply put, that’s the price of the index over the forecast of earnings over the next 12 months. On this measure, the market is trading at ~23x forward earnings, which is quite a bit above the historical average of ~17x, and not too far from the highs seen in the tech bubble in early 2000.
That’s not to say that we will see a similar collapse to the one we saw in the early 2000s. Multiples in part are driven by where we are in the business cycle. Typically, you see multiples peak as the economy is heading into a recession, hit a low, and then bounce as investors anticipate the recovery. This business cycle has been very unique — rather than natural market forces, it was a shock to the system driven by the pandemic and the lockdowns that followed that really hit the market in a very compressed time frame.
We have already come through the collapse in multiples last year, when they fell from 19x at the beginning of 2020 to a low of 13 times in March. Since then, multiples have expanded quite significantly as investors have looked past the worst of the pandemic, anticipating a quicker recovery than you would normally see in a traditional recession.
Another sign of (perhaps excessive) investor optimism is more qualitative. Investor sentiment surveys, such as the one that measure the percentage of bulls versus bears, are very high. The IPO market last year hit record levels and continues to be quite strong this year. The popularity of stock trading platforms like Robin Hood has exploded and is bringing more and more individuals into the market. Finally, you have the concerning behavior of stocks like Tesla, which has risen close to 50 percent since the end of November, when it was added to the S&P 500.
Valuation in and of itself is a very poor predictor of equity returns, especially in the short term over a one-year period where there is virtually no correlation between valuation and returns. In fact, it’s very hard to find anything that correlates with one-year returns, given the amount of noise and the number of other factors that can drive the market. Valuation is a much better predictor for returns in the long run.
Interest Rates
Interest rates also have a significant influence on valuation. The one measure where stocks still look attractive is relative to bonds and rates.

These charts show the S&P 500 earnings yield versus the 10-year Treasury yield. Right now, the gap between the two is still fairly wide as compared to historical levels, indicating more value in equities relative to lower-yielding fixed income.
The risk is if interest rates rise too far and too fast, that could become a threat to valuations. When rates are rising because of better growth prospects, that is generally a positive for stocks. If interest rates rise too quickly, though, it could be a sign that perhaps investors see inflation and not just reflation on the horizon. We could also see a period like the 2013 “taper tantrum” when the Fed pulled back too quickly on their asset purchases and equities corrected. Certainly, rising rates could be disruptive for equities, but the reason why rates are rising is important, and so the growth outlook becomes a key factor.
Corporate Fundamentals
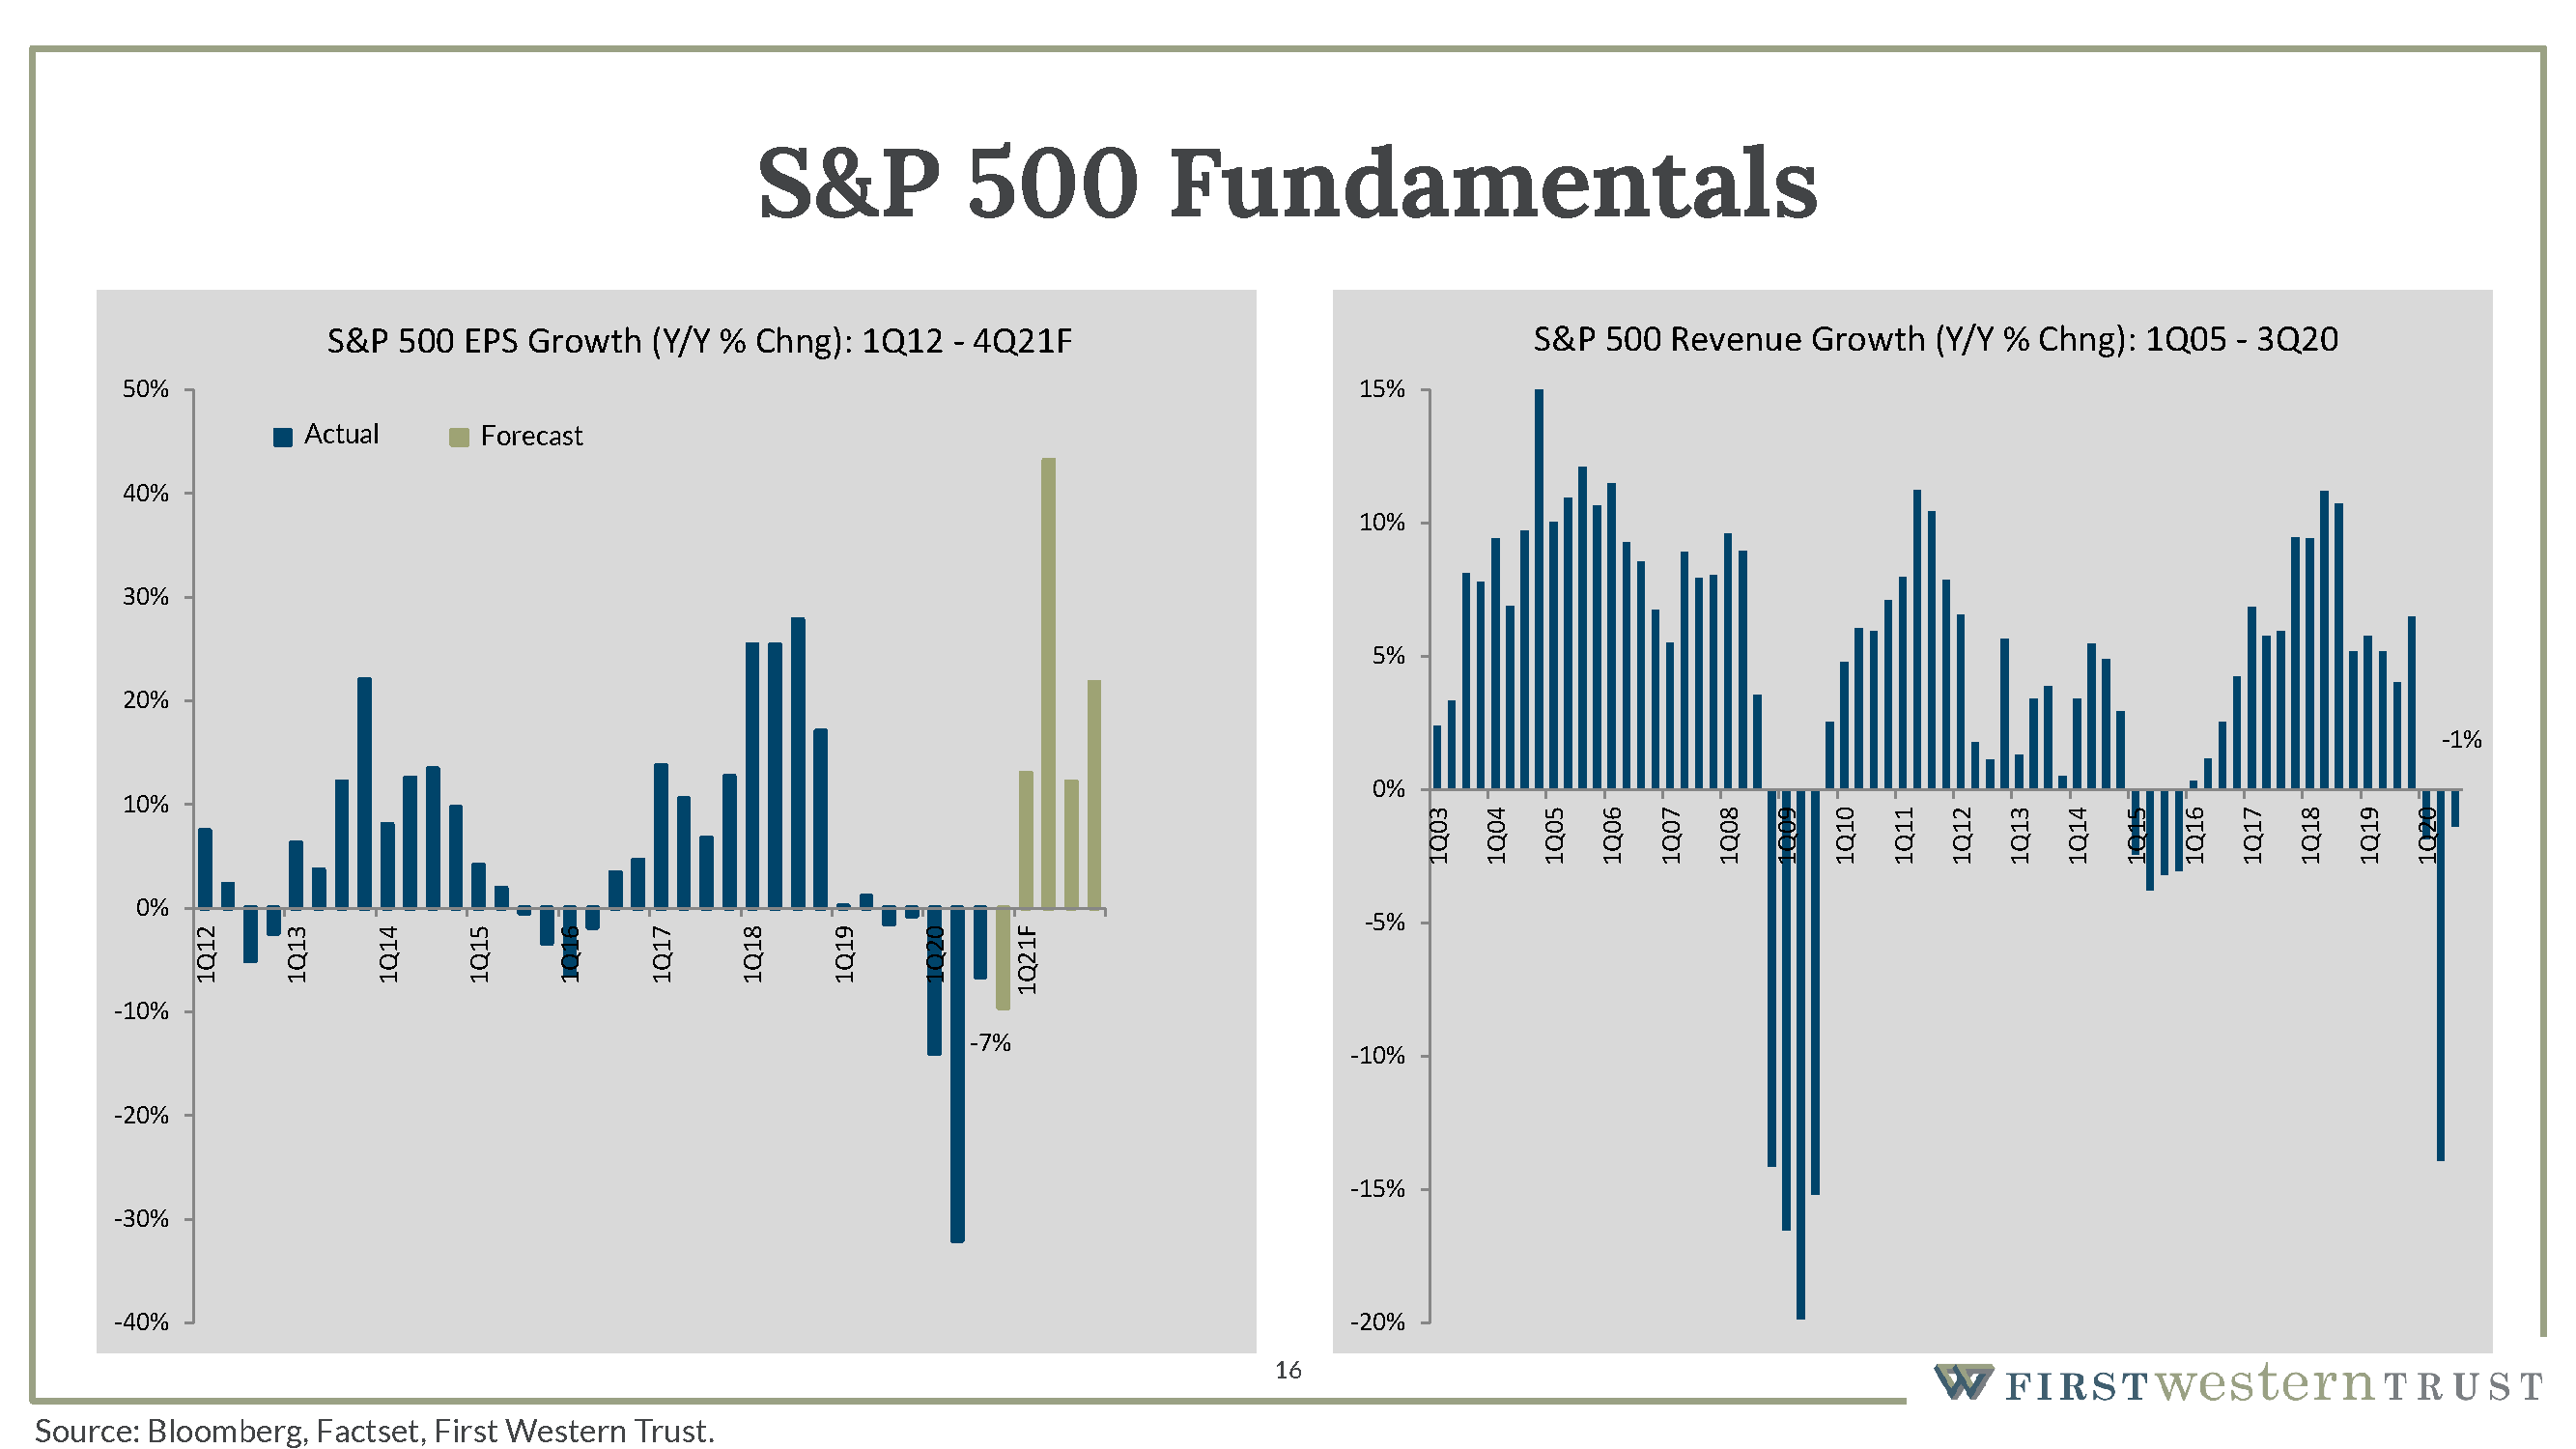
Unlike valuations, we think corporate fundamentals should be a bright spot and earnings growth the primary driver of returns for the year. On the left chart above, you can see the quarterly growth in earnings per share for the S&P 500. On the right is displayed revenue growth.
Unsurprisingly, the pandemic significantly impacted corporate profits last year, with the second quarter being the hardest hit. Earnings were down over 30%, and revenue was down close to 10%. But since then, things have rebounded quite quickly and we’re seeing sequential improvement in corporate profits despite the continuing impact of COVID.
In part, that recovery is thanks to the massive stimulus that provided a significant bridge to the consumer. We also saw impressive resilience among businesses, which adapted quite well to the changing environment — in fact, in the third quarter of last year, excluding airlines, energy, and travel, earnings growth was actually positive.
For 2021, earnings are expected to be quite strong with growth over 20%, and could hit a new high, exceeding 2019 levels. Obviously you have very easy comparisons to last year, which influences the growth rate, but we also think there is a tremendous amount of pent-up consumer demand given where household income stands relative to spending. As vaccinations become more widespread and the economy starts to re-open more fully, you could see a strong rebound in consumer spending.
Growth vs. Value
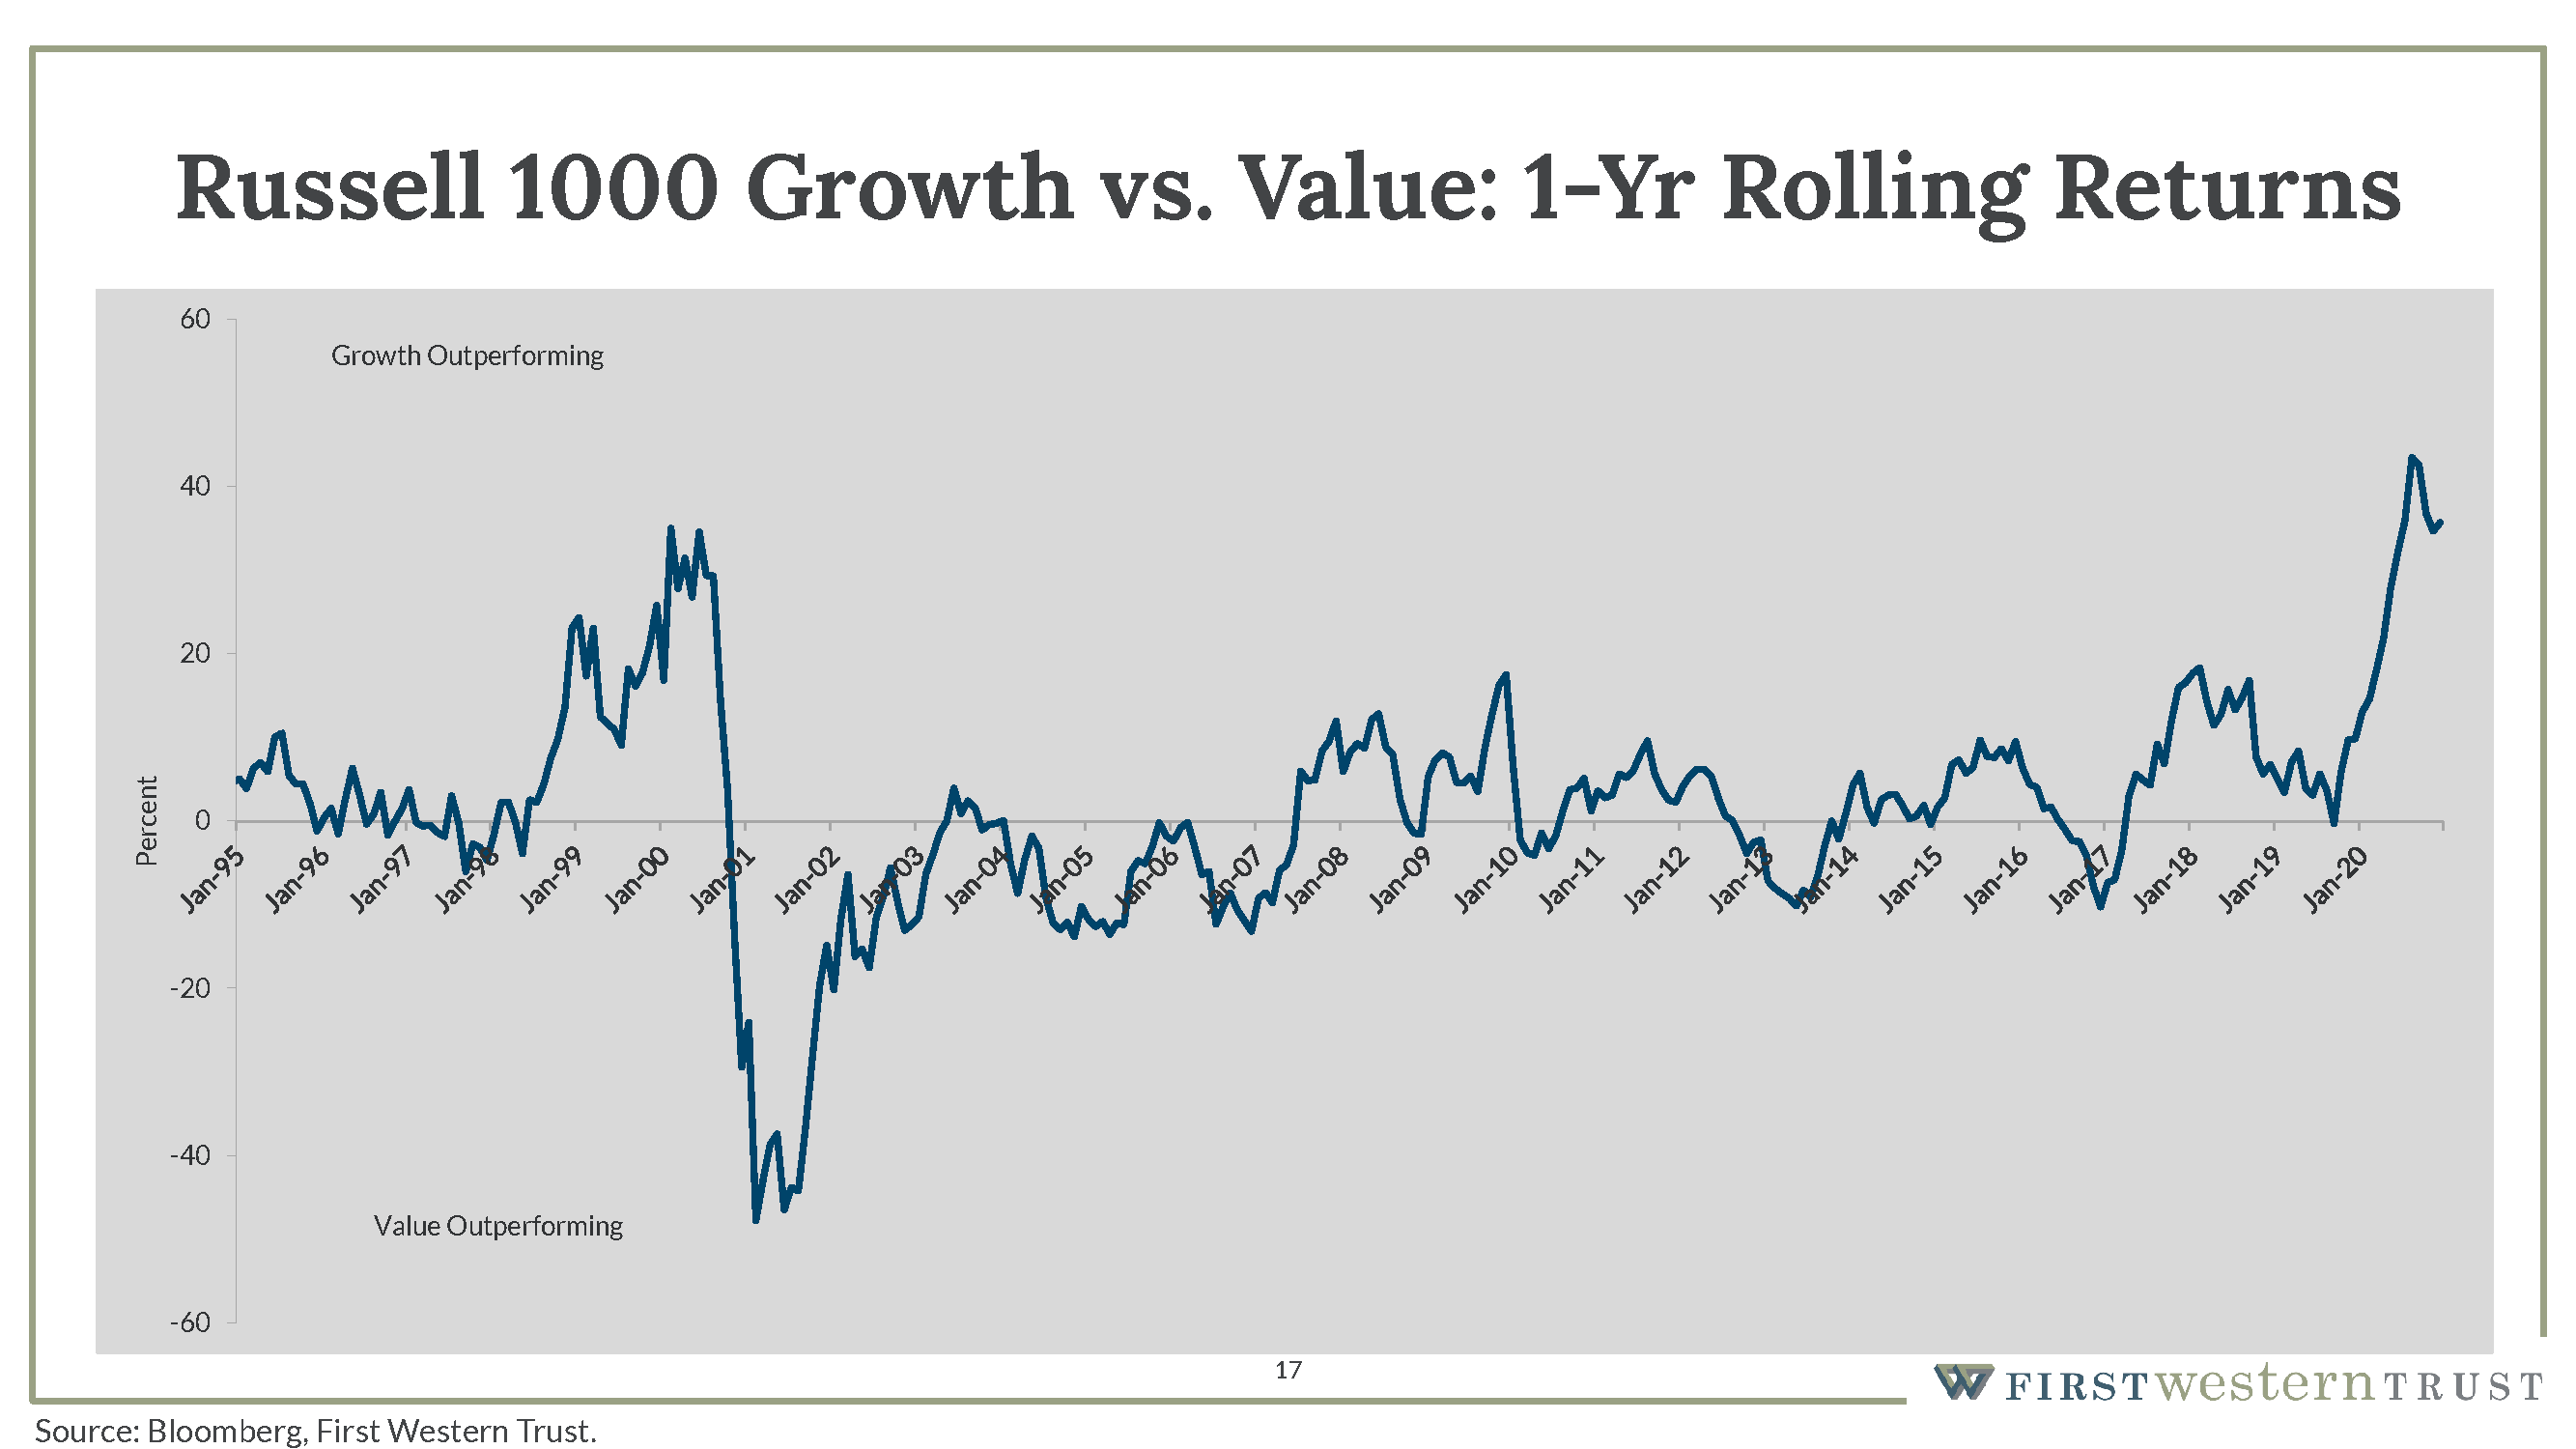
Another topic being debated among investors is growth vs value. This chart shows the difference in returns between growth stocks and value stocks. From the significant uptick on the right side of the graph, you can see that growth stocks have outperformed significantly over the past year. As the economy recovers this year, it would not be too surprising to see value stocks enjoy a period of outperformance. That’s not to say that growth stocks will decline outright, but just that their outperformance may pause.
But the distinction between growth and value is somewhat arbitrary, given the rules are set by the index provider. What is value to one investor may look differently to another. Instead of growth and value, we see the debate as more accurately described as between cyclical and defensive stocks. Cyclical stocks should do well as the economic growth accelerates, but cyclical stocks contain both value areas, like banks, and growth stocks, like semiconductors. Defensive stocks could lag for a while, such as consumer staples and software, two areas that did very well last year as the pandemic drove work-from-home / stay-at-home behavior.
Policy Impacts of the Biden Administration
With any new administration can come a slew of new policies that can impact different sectors, positively or negatively. Some of the highlights we anticipate include:
- Infrastructure: there seems to be clear bipartisan support for some sort of significant infrastructure bill — anything from upgrading the electrical grid to universal broadband, broadband to rural areas, and simply rebuilding roads and bridges
- Clean energy: this is a clear priority for the new administration. We might see higher tax incentives for green energy and renewables in addition to tighter regulations on oil and gas.
- Healthcare: we’re not likely to see sweeping changes in healthcare policy, though we might see an appetite for restrictions on drug prices or allowing Medicare to negotiate drug prices, which could impact biotech and pharmaceutical companies.
- Tax policy: President Biden’s current proposal is to raise the corporate tax rate from 21 to 28 percent, to impose a minimum tax on all corporations, and perhaps to implement other social security and payroll tax changes, all of which might present a headwind to earnings in 2022.
Some of these changes will take effect quickly, while others will take years to fully take effect. With all the stimulative spending that’s being proposed in addition to more restrictive legislation, the policies could very well offset each other and present a net neutral environment to equities.
Investors will have a lot to keep their eyes on in the next few years, and it will help to have a financial advisor you can trust. At First Western Trust Bank, we pride ourselves on our proprietary, holistic approach to every client’s account and financial plan. We’ll examine your personal wealth picture in light of the broader marketplace and craft a plan that’s right for you. Get in touch today.
Investment and insurance products and services are not a deposit, are not FDIC insured, are not insured by any federal government agency, are not guaranteed by the bank and may go down in value. Opinions and estimates offered constitute our judgment and are subject to change without notice, as are statements of financial market trends, which are based on current market conditions. This material is not intended as an offer or solicitation for the purchase or sale of any financial instrument. This material has been prepared for informational purposes only, and is not intended to provide, and should not be relied on for, accounting, legal or tax advice.

Insights
Week in Review: May 26, 2026
Recap & Commentary U.S. equity markets ended positive on the week as investors grew increasingly optimistic that diplomatic negotiations between […]
Learn more
Week in Review: May 15, 2026
Recap & Commentary The S&P 500 ended the week effectively unchanged while most other equity indices closed lower, pressured by […]
Learn more
A Strategic Approach to Business Wealth Diversification
For many entrepreneurs and business owners, building a successful company becomes far more than a professional achievement. It becomes the foundation o
Learn more
April 2026 Market Commentary
After a bruising March in which fighting between the US and Iran triggered a global energy supply shock, reignited inflation […]
Learn more
Week in Review: May 8, 2026
Recap & Commentary Markets ended the week higher with the S&P 500 at a new record high, as the index […]
Learn more
Ready to learn more?
Let’s have a conversation.
Embark on a banking experience tailored to your distinct path, focused on achieving personal and business financial prosperity.