


2021 Economic Outlook: Politics, Covid, and the Economy
February 12, 2021
The year 2020 was a chaotic one, and we’re sure that, like us, many of you are glad it’s finally over. But while some of the factors that made 2020 unpredictable have turned a corner, it will be quite some time before the American economy and society have fully recovered. The impact of COVID-19, as well as the 2020 election, will continue to reverberate through 2021. To proactively address and mitigate against risk in your wealth picture, we’ve analyzed the key economic factors to consider in your 2021 financial planning.
The 2020 Election
The 2020 election has shifted control of the Legislative and Executive branches of government to the Democratic party, which now holds a majority in the House of Representatives, the Senate, and the Presidency. Despite the current balance of power, the Democrat’s control in the Senate is tenuous with a 50/50 split in seats. Such a position does is not a mandate and will not likely enable far reaching Democratic goals.
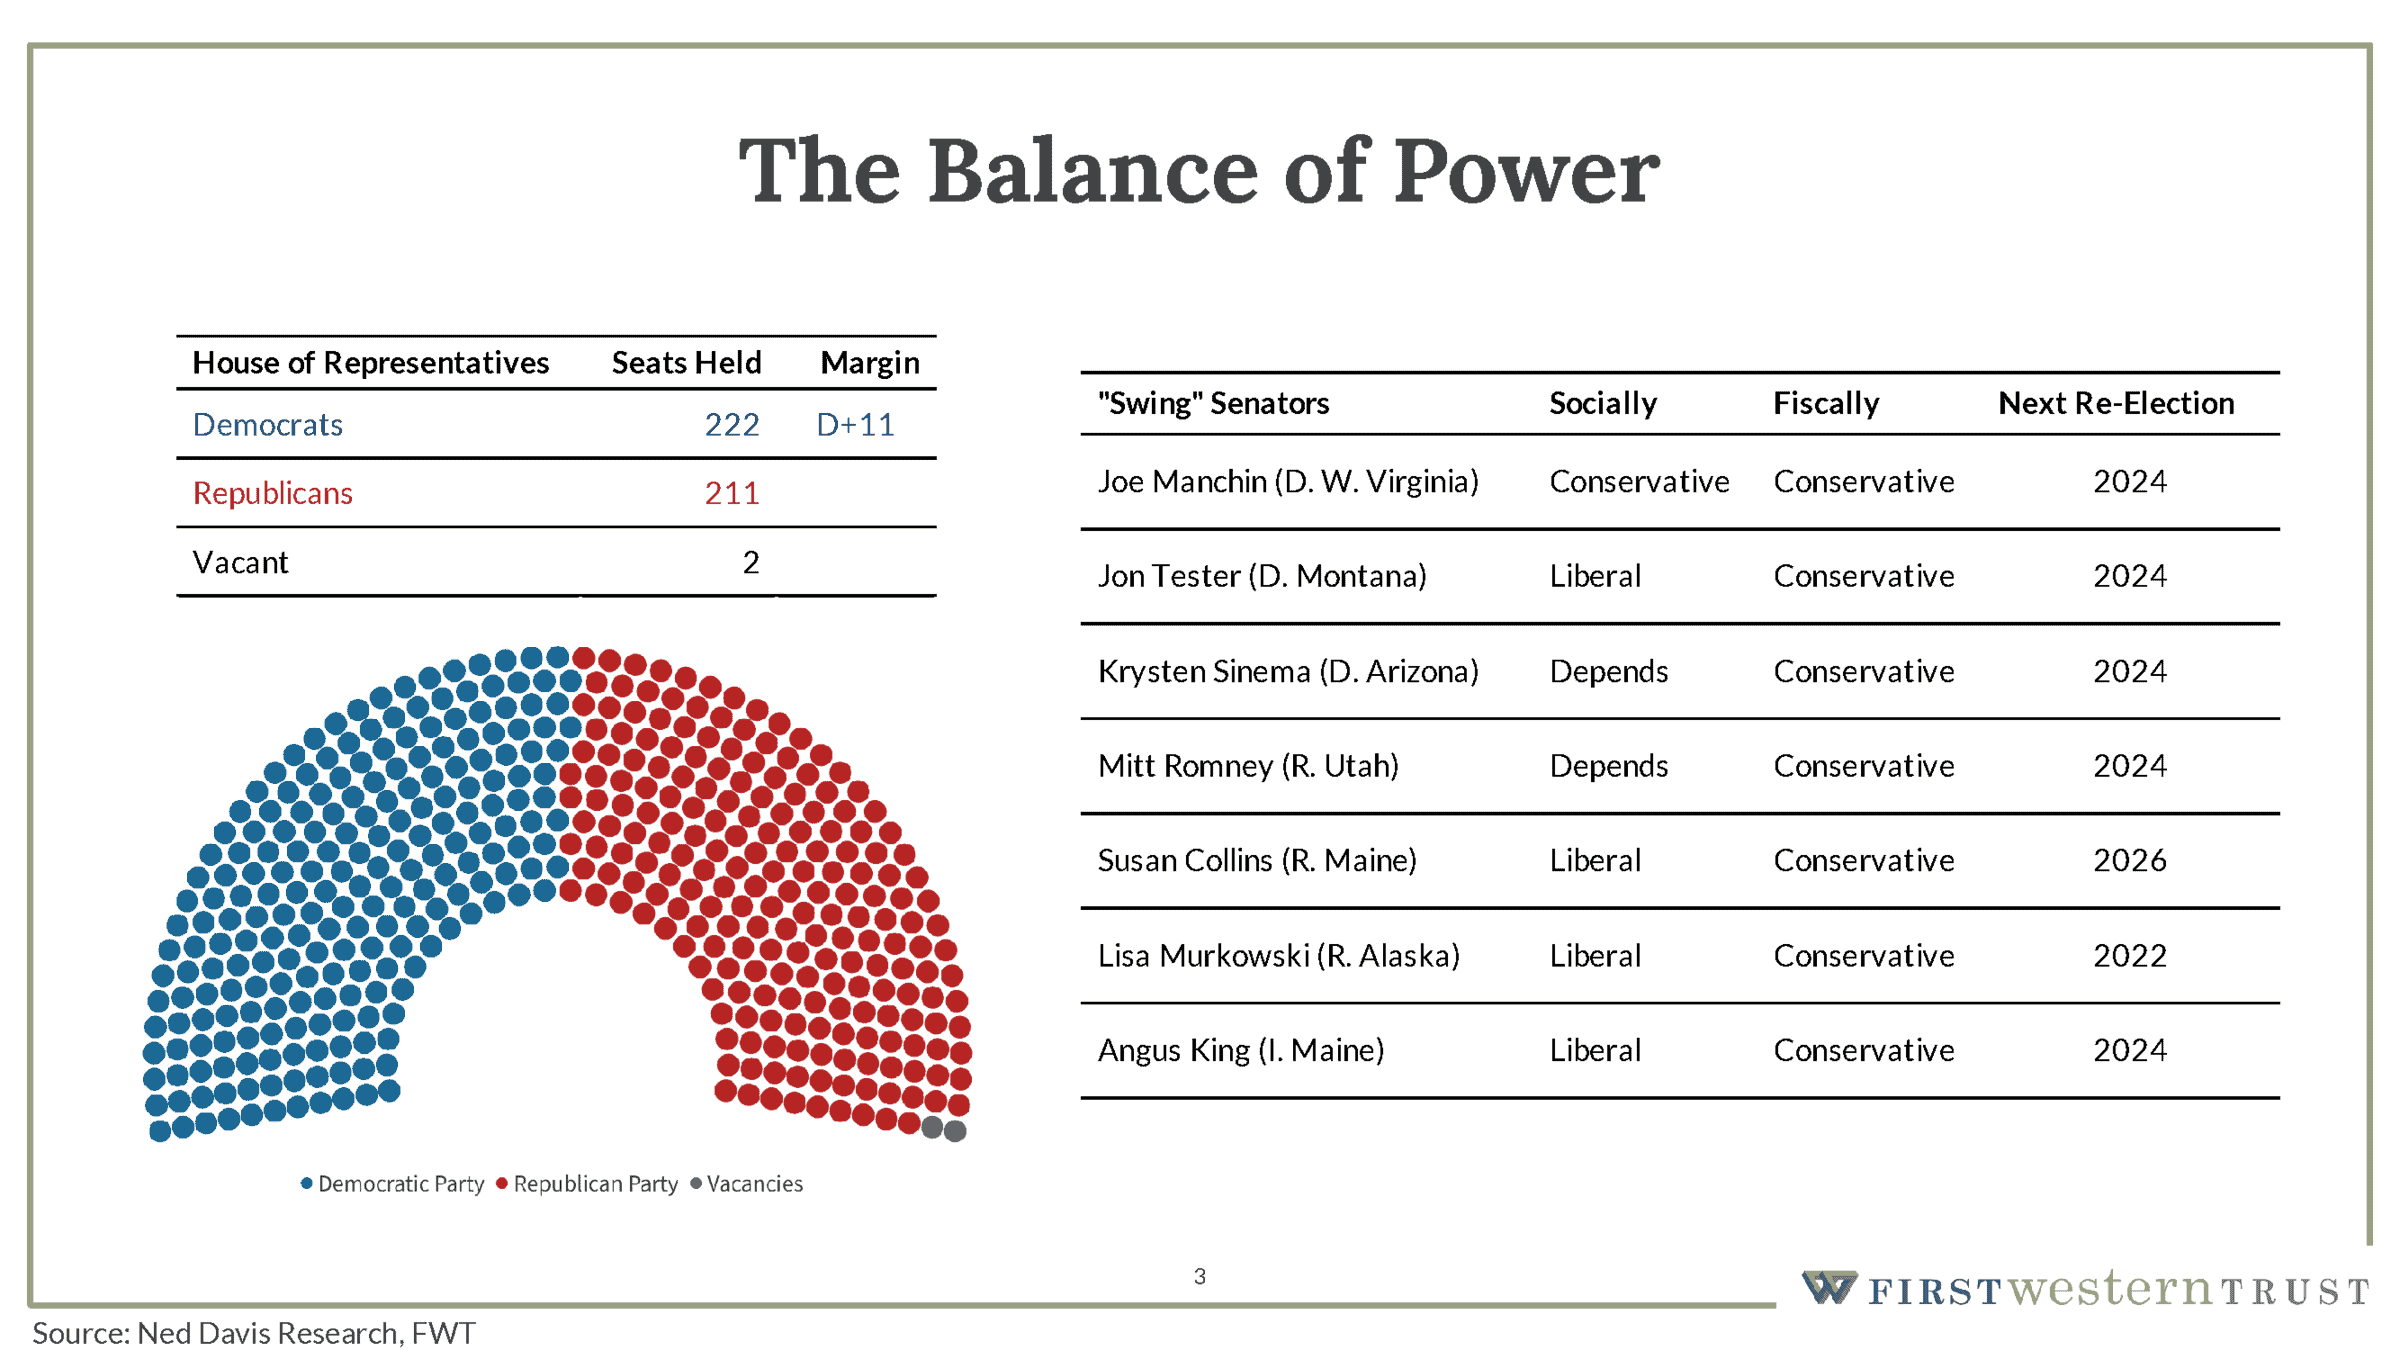
Following the November 2020 elections, the Democrats held an 11-seat majority in the House. While this is a clear majority, it is notable that this is down meaningfully from the majority held in the previous session of the 116th Congress, where they averaged a 37-seat margin.
Eleven seats is a fairly slim majority and one also that will weigh on decisions about potential changes going forward. In the grand scheme of potentially controversial legislation, the 2022 midterms are not far away.
The Senate is a different beast altogether. While it’s reasonable to conclude that the Democrats have control in the Senate, they do so with 48 seats on the Democratic Party, two Independent senators — Angus King from Maine and Bernie Sanders from Vermont — and the vice president who can vote in the instance of a tiebreaker.
Many of you will recognize the names on the right side of this slide — fiscally speaking, most of these names are moderate Democrats or centrist Democrats that may not necessarily rubber-stamp any proposals along party lines. Given these relatively slim majorities, we anticipate a much more moderate legislative agenda going forward.
What we will see — and what we got a taste of over President Biden’s first few days in office — is extensive use of executive orders. Through January 28, President Biden has issued executive orders (among others) that:
- Extended the pause on federal student loan payments
- Expanded employment protections for federal employees
- Increased federal investment in U.S.-based companies
- Placed a temporary moratorium on oil and gas expansion in the Arctic National Wildlife Refuge and revoked the Keystone XL Pipeline permit
- Rejoined the Paris Climate Agreement
- Halted the renewal of all Justice Department contracts with private prisons
We expect a rush of executive orders in the near term that will unwind many of the Trump administration executive orders tied to the environment, the energy sector, and trade.
The Impact and Future of COVID-19
COVID-19 by far had the most significant impact on the global economy in 2020. The sustained rise in recorded cases across the globe, along with historic levels of unemployment claims and challenges experienced with the vaccination rollout, have ensured its effects will continue to be felt.
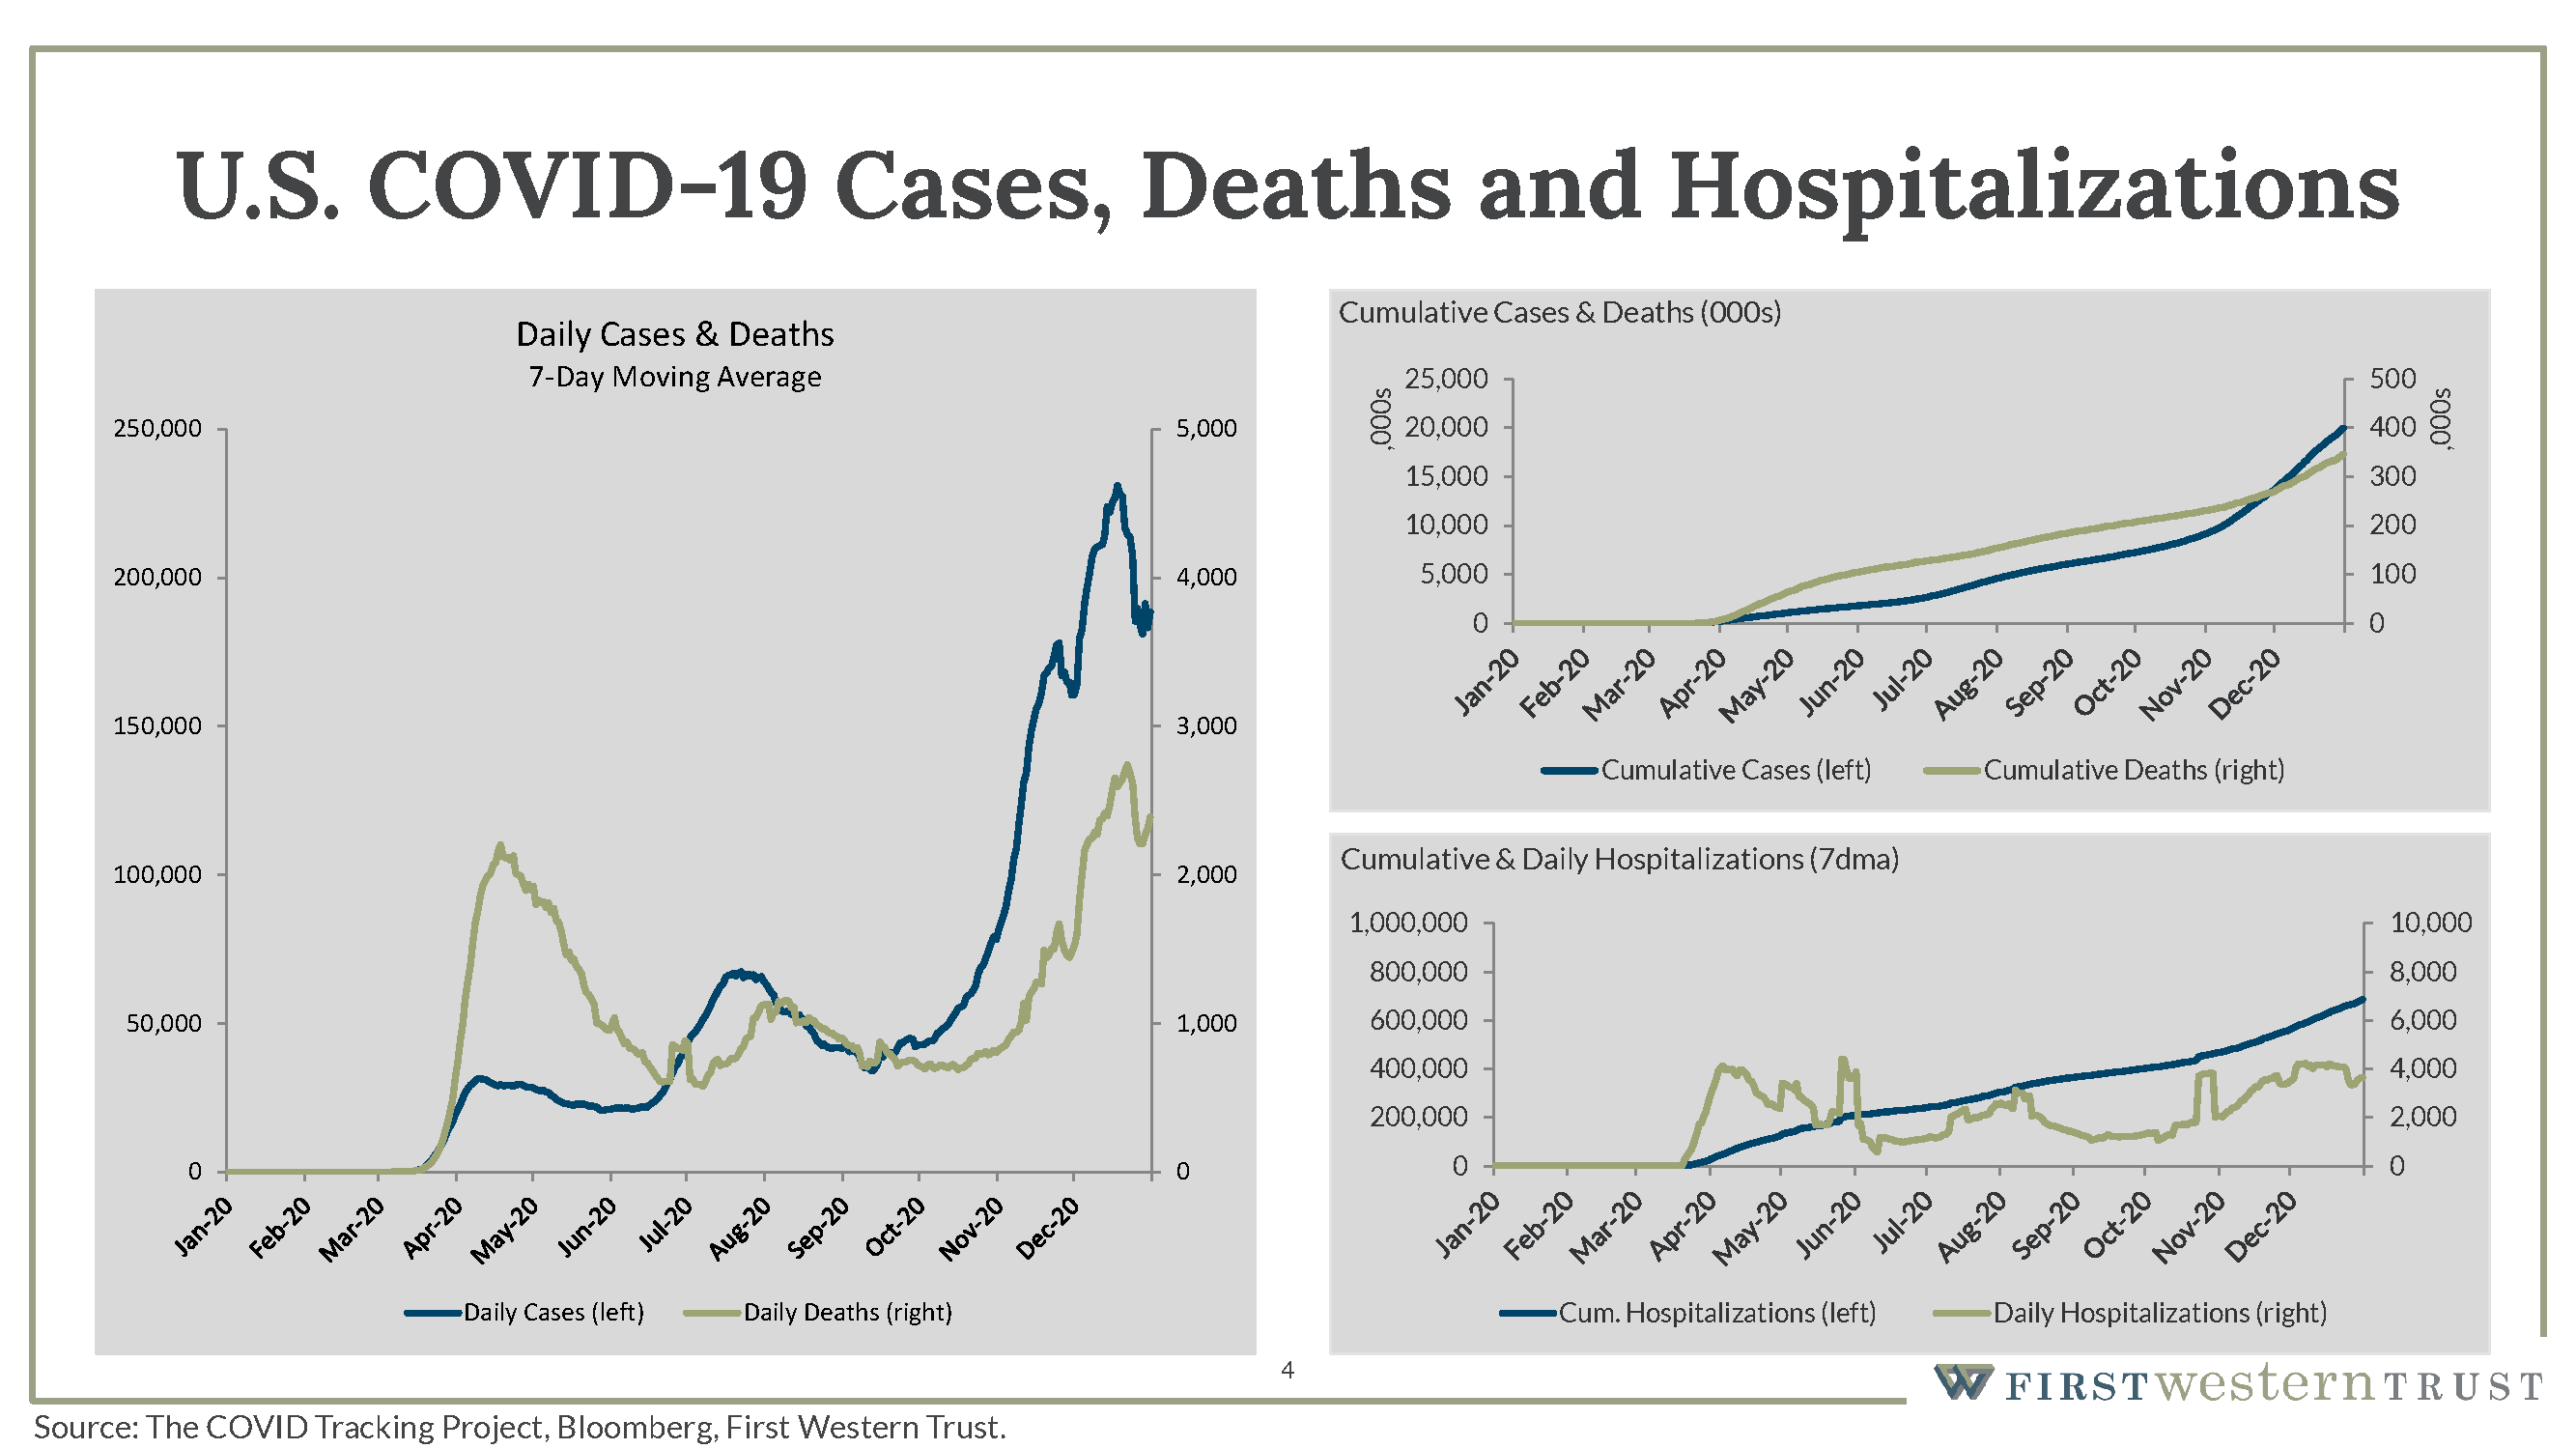
The most significant spike in new cases came in the fourth quarter of last year, with new daily cases represented in blue and daily deaths represented in green. This coincides with considerable holiday travel and family gatherings around Thanksgiving and Christmas, a significant uptick over the subdued travel numbers of the last year.
We’ve already seen those numbers begin to abate, and we expect to see a return to pre-holiday travel levels as we get into February. Once we move into the spring with temperatures warming and more effective inoculation throughout the country, we should start to see more sustained improvements moving forward.

The challenge is vaccination rollout. On the panel on the right above, the green line represents the number of doses in millions that have been distributed to various states and local health departments. But the blue line represents the number of inoculations relative to those distributions. This remains a logistical challenge that needs to be faced.
President Biden has made the vaccine rollout a primary talking point of his first 100 days, targeting 100 million citizens vaccinated in the first 100 days..

Because of the somewhat slower start in December and so far in January, we expect this timeline to be pushed back several months from its original design. While the initial expectation was that phases 2 and 3, covering the biggest cross-sections of the population, would begin in April, we expect those phases not to be complete until the late summer and fall. Right now, the focus is still on the inoculation of frontline workers, the elderly, and citizens with morbidity issues that need to be addressed. While the start of this vaccination effort hasn’t gone smoothly, we’re starting to see the light at the end of the tunnel.
Economic Conditions in 2020
Tied to the impacts of the pandemic response, the global economy has experienced deep recessionary activity. This crisis prompted a response by the US government to issue stimulus funding to individuals and small businesses, with another proposed round on the way, and the Federal Reserve Bank expressing its intent to maintain a near 0% interest rate policy.
GDP and Stimulus Spending

As illustrated above, annualized fourth-quarter GDP in 2019 came in just under $20 trillion. The next column illustrates the third quarter of 2020, annualized GDP for comparison. While GDP dropped roughly 3.5 percent, it’s important to note that without the amount of federal stimulus that went into the economy, it’s likely that we would have seen closer to a 15 percent fall in year over year GDP. The stimulus we saw in March 2020 was very much needed to support the economy and bridge the gap until a Covid response was in place.
In addition to the noted stimulus plan, in December, there was another $900 billion plan passed that should impact the first quarter of 2021. On top of that plan, President Biden has proposed another $1.9 trillion plan that equates to about 10 percent of GDP. Taken together, these should provide ample support at least through the first if not the second quarter of this year, as we begin to stabilize and move into a more sustained recovery phase.
Labor Markets in 2020
The labor market mirrored the drop in GDP and was significantly impacted in the early part of 2020.

On the slide above, you can see the long-term job loss and recovery from previous recessions. Specifically, we’re interested in how long (in months) the economy took to regain the jobs lost during the recession.
The 2008 recession was especially problematic — it was nearly six years before the labor markets fully bounced back, and there was considerable scarring on the economy overall. This was one of the contributing factors that led to slower long-term growth in GDP overall in the United States during that period.
The most recent month of job gains (November 2020) was actually a loss of 140,000 jobs, and the unemployment rate held steady at 6.7 percent. We think that job gains will pick up once the stimulus money and the next round of stimulus is passed into the economy.
In the middle of the chart is a legend that details how many jobs per month need to be added to recover those that are lost. We have a very, very steep hill to climb — even to recover the lost jobs over the course of four years would require 200,000 jobs a month to be added to the economy. In 2019, by contrast, the nation added 171,000 jobs per month.
Though that number sounds close, the unfortunate challenge is that we would need 200,000 to 250,000 jobs a month in addition to that average run rate. The American economy needs roughly 100,000 new jobs per month just to maintain new entrants into the job market, which means we’ll need to see job creation rates roughly double in order to recoup the job losses we’ve seen in the last 12 months.
Job losses have not been evenly distributed — we’ve seen focused and concentrated losses within various sectors of the employment picture across the United States.

The most significant impact was felt within leisure and hospitality, where only about 55 percent of those jobs have been recovered. Education and professional businesses were significantly displaced as well. Further right on the graphic, you’ll note that the government is one of the few areas that has declined since April 2020 rather than recovered. One of the key points of President Biden’s proposed stimulus plan is to provide a significant amount of money to state and local municipalities to at least stem that flow, if not to provide the support to bring those employees back online.
If there’s a silver lining to this slide, it’s the impact on the leisure and hospitality industry. There’s considerable pent-up demand from consumers to participate in leisure and hospitality activities. Once we start to see reasonable vaccination rates, we expect to see a rapid reopening of the economy, helping leisure and hospitality jobs recover at a faster pace than many other segments.
Interest Rates in 2020
Interest rates have been a specific focus since the beginning of this disruption starting early last year.

The left panel on the slide above depicts the end of the year yield curve as of December 31, compared to December 2019 and December 2018. As you can see, even moving into the end of 2019, is a steady progression of lower and lower rates. The bright side is that the shape of the yield curve improved in 2020, from that seen in 2019 and 3018.. The return of a positive sloped yield curve is supportive of a normalizing economy. And although the rate levels themselves suggest slow growth, it also suggests overall economic stabilization.
This recent steepening is very constructive for the financial services segment generally and banks in particular, in that it supports better and more robust net interest margin, which encourages banks to provide more liquidity and lending to the economy overall.
If banks didn’t see the opportunity of lending as a profitable endeavor, they would lend less and choke off liquidity to businesses, which would have the impact of slowing the economy. Overall, we find the steepening of this curve to be very constructive, which should keep bank’s healthy and eager to continue to lend.
The right side is simply another way to represent that steepness. What’s shown in the right panel is the difference between a two-year treasury note and a 10-year treasury bond. Throughout 2020, we’ve seen meaningful steepening in that curve from almost zero to about 80 basis points, creating a much-improved lending environment overall.
Inflation in 2020
One of the primary concerns that has been coming out of the unprecedented amount of stimulus is the potential impact on inflation.

The left panel shows PCE, which is the Federal Reserve’s preferred method of measuring inflation. While inflation has been erratic for the last ten years, it has also been relatively subdued. For the past decade, the Federal Reserve has been explicit in its target of maintaining a two percent inflation rate in the economy. Recently, they changed that outlook from a steady two percent to an average of two percent, indicating that they would allow the economy to run at a higher than two percent inflation rate for some periods of time to make up for periods where inflation fell below that target.
It should be noted, despite the concerns related to potential inflationary pressure from additional liquidity, that the US Federal Reserve (and central banks around the world) are still more concerned about deflation and disinflation than they are inflation. This is why we’ve seen such accommodative postures globally from central banks throughout the crisis.
It’s also worth noting that the average level of the PCE series is 1.6 percent — nowhere near the two percent growth rate or inflation rate that is the Federal Reserve’s target. The Federal Reserve is burdened with a dual mandate: to maintain price stability and to maintain full employment. While they aren’t really clear on what defines full employment, the widely accepted definition is roughly a four percent unemployment rate. Right now, we’re at 6.7 percent. Until we start seeing higher inflation, coupled with a return to at least below 5 percent unemployment, it’s unlikely that we’re going to see any change in the Federal Reserve’s interest rate policy.
Looking Forward
There are a lot of changes to keep an eye on in the next few years, but getting beyond Covid and successfully reopening the US economy is the foremost challenge. US Markets appear optimistic that last year’s disruption is largely past us. The remainder of 2021 will need to add substance to this outlook but current trends are constructive.
What’s important is that you stay informed and talk to a financial adviser you can trust. At First Western Trust, we’ve paid close attention to the financial markets during these tumultuous times. We’ll take into account the details of your unique situation and the market conditions to build a financial plan that’s right for your goals and priorities. If you’re ready to look forward with confidence, talk to First Western Trust today.
Investment and insurance products and services are not a deposit, are not FDIC insured, are not insured by any federal government agency, are not guaranteed by the bank and may go down in value. Opinions and estimates offered constitute our judgment and are subject to change without notice, as are statements of financial market trends, which are based on current market conditions. This material is not intended as an offer or solicitation for the purchase or sale of any financial instrument. This material has been prepared for informational purposes only, and is not intended to provide, and should not be relied on for, accounting, legal or tax advice.

Insights
Week in Review: May 15, 2026
Recap & Commentary The S&P 500 ended the week effectively unchanged while most other equity indices closed lower, pressured by […]
Learn more
A Strategic Approach to Business Wealth Diversification
For many entrepreneurs and business owners, building a successful company becomes far more than a professional achievement. It becomes the foundation o
Learn more
April 2026 Market Commentary
After a bruising March in which fighting between the US and Iran triggered a global energy supply shock, reignited inflation […]
Learn more
Week in Review: May 8, 2026
Recap & Commentary Markets ended the week higher with the S&P 500 at a new record high, as the index […]
Learn more
Why High-Net-Worth Families Are Prioritizing Strategic Planning
Recent family office and wealth research from PwC suggests many affluent families are placing greater emphasis on strategic planning, governance, and long-term coordi
Learn more
Ready to learn more?
Let’s have a conversation.
Embark on a banking experience tailored to your distinct path, focused on achieving personal and business financial prosperity.