





Week in Review: October 16, 2026
October 19, 2026
Summary
- AI stocks down on concerns about the strength of the investment cycle.
- Treasury yields fell as investors sought safe haven assets.
- Consumer inflation (CPI) jumped to 3.7%, its fastest annual pace in four months.
- Third quarter S&P 500 earnings growth expected to be 29%.
Overview
Markets generally ended the week lower as investors focused on the start of earnings season, a further selloff in AI-related stocks, and inflation data.
Inflation at both the consumer and producer level experienced renewed pressure in September due primarily to elevated energy prices. At the headline level, consumer inflation (CPI) rose 0.6% for the month, the largest monthly increase since April, driven by a 9.1% increase in gasoline prices. Compared to a year ago, headline CPI accelerated to 3.7%, its fastest pace since May. Core CPI, excluding food and energy, rose 0.3% for the month and 2.6% from a year ago. from a year ago, as CPI.
Producer inflation (PPI) at the headline level jumped 1.3%, nearly triple August’s 0.5% increase. Compared to a year ago, PPI rose to 6.3%. Core PPI, excluding food and energy, rose 0.7% for the month and 5.0% from a year ago.
The elevated inflation readings brought renewed attention to the Fed, once again spurring speculation about the timing of the Fed’s next rate hike. Market expectations for an October hike, however, were largely unchanged at ~15%, due in part to recent comments by several Fed members, including Governor Christopher Waller who said there is “flexibility” around the timing of the Fed’s next rate hike. Markets continue to believe the Fed will raise rates by its December meeting.
Consumer continued to spend in September as evidenced by a 0.8% increase in retail sales. However, much of that was driven by spending on gasoline, which rose 6.4% for the month and 28% from a year ago. Excluding gasoline sales, retail sales rose just 0.2%. A more nuanced version of the report, referred to as control sales, which factor into the calculation of GDP, rose just 0.1%, following a 1.2% increase in August, suggesting consumer spending cooled at the end of the third quarter.
Through Friday, 9% of S&P 500 companies had reported earnings. Thus far, 84% have beaten their consensus estimate. According to industry group FactSet, consolidated S&P 500 earnings growth for the third quarter is expected to be 29%, which if realized, would be the third consecutive quarter of earnings growth above 25%. While the “Magnificent 7” (Mag 7) companies are once again expected to drive growth, with aggregate earnings up 33% from a year ago, earning growth for the other 493 companies is expected to be a very strong 28%.
US oil prices saw renewed upward pressure, climbing 10% to end the week at $101, a four-week high. The increase resulted from renewed concerns about supply and strong demand. In the Middle East, Iran intensified its attacks on shipping through the Persian Gulf, attacking at least 12 ships, two of which were sunk. In addition, Ukraine resumed striking Russian energy infrastructure targets after suspending attacks for several days following President Trump’s announcement of an energy truce between Ukraine and Russia. Signs of strong demand were reflected in a larger-than-expected draw on US inventories.
The Details
Equities
The equity market tone changed, as the S&P 500 and Nasdaq fell 1.9% and 4.5%, respectively, extending weakness from the prior week. The S&P Equal Weight index outperformed for the second straight week, rising 0.5%. Small caps (Russell 2000) which had been tracking the S&P 500 Equal Weight of late, diverged, falling 3.0%.
The S&P 500 and Nasdaq were led lower by the technology sector, which accounts for approximately 38% and 54% of the two indices, respectively. The sector fell 6.4% for the week, including a 9.6% decline in semiconductors and 3.6% in software. Semiconductor shares finished the week on a nine-day losing streak, the longest since 2006. The Mag 7 fell 2.8%, with Apple the only positive contributor. The common thread across technology and the Mag 7 is concern about the AI cycle. Fears of a cyclical peak, competition from China, disruptive job losses, and now debt concerns among weaker players have accumulated week after week, challenging investor confidence.
The steep decline in the Russell 2000 paints a cautious picture of investor risk appetite. Its weakness appears to reflect a flight to quality. While the Russell 2000 fell 3.0%, another small-cap index, the S&P 600, fell only 1.2%. The primary difference between the two is the inclusion of unprofitable companies, which account for ~40% of the Russell 2000. The S&P 600 includes only profitable companies. The Russell 2000 is now down more than 11% from its all-time high on August 4th. The flight to quality was also evident in the relative strength of sectors typically categorized as defensive, including utilities, healthcare, and consumer staples. The decline in 10-year Treasury yields likely reflected some flight to quality as well.
Weakening index breadth has been evident in recent weeks, as the average stock struggles while the index remains near its all-time high. Research from Citadel Securities illustrates how unusual current conditions are. According to its research, the number of 1% or 2% index moves in recent months is very low relative to a typical period. The index is also approaching a full year since its last severely negative trading session, defined as more than 80% of trading volume concentrated in declining stocks. The average year typically produces 21 such sessions, and the longest prior stretch without one was 121 trading days over the past 30 years. We currently stand at 225 trading days since the last event, by far the longest stretch on record.
There are reasons for the market’s recent resilience. Company results have been spectacular and are expected to remain strong in the near term. Still, periods of extreme calm typically break one way or the other. Weakening breadth suggests the risk is currently to the downside. This week’s cracks in AI and lower-quality stocks add to the list of warnings. The depth and duration of any market squall will ultimately depend on current earnings and expectations for future results.
Large banks kicked off third-quarter earnings season during the week, with JPMorgan, Goldman Sachs, Citigroup, Bank of America, Morgan Stanley, and Wells Fargo reporting results. Profitability (ROE) remained near cycle highs, though growth cooled from the white-hot levels of the second quarter. Market leaders JPMorgan and Goldman both commented that every business line is operating at high levels of profitability, noting this is rare. This speaks to a broader issue facing many large companies. Current financial results are spectacular in both growth and profitability. Mathematically, however, growth could slow in coming quarters, even if it remains healthy and profitability stays strong. Hyperscale cloud and semiconductor companies may face a similar issue beyond third-quarter results. That transition may be contributing to the market’s current gyrations. This week another 79 S&P 500 companies will report results, providing further insight into the state of the economy.
Fixed Income
With CPI and PPI showing hotter-than-expected inflation, a further rise in yields would have been the expected response. Instead, Treasuries defied that expectation, largely rallying during the week. On Thursday, the rally accelerated, led by the long end of the yield curve, as the equity selloff drove a flight to quality and algorithmic and hedge fund trading amplified the move. In the end, the AI-driven equity selloff mattered more for bonds than the inflation data, with the flight to quality overwhelming the expected response to CPI and PPI. While Friday partially reversed that move, the week overall highlighted bonds’ traditional safe-haven role. Week over week, the 2-year Treasury yield fell 8 basis points, the 5-year fell 14 basis points, the 10-year fell 16 basis points, and the 30-year fell 17 basis points.
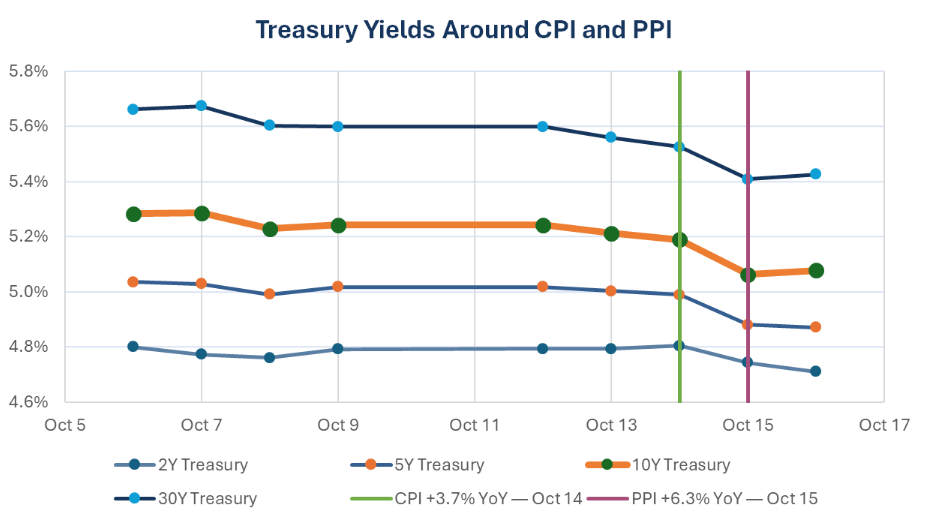
Source: Bloomberg
The corporate bond market has seen record issuance this year, though the past month saw a major pullback as borrowers become more sensitive to higher interest rates. Still, last week saw some reentry, with post-earnings issuance from large banks leading the way. Although total new issuance still fell short of projections, the return of more typical post-earnings supply was viewed as supportive. Morgan Stanley issued debt for the first time since July, while Bank of America completed a rare Friday deal. Weak secondary performance after issuance also continued, with only about 50% of new deals receiving pricing support, down from 68% the prior week. That weakness may affect both the forward calendar, as issuers reconsider when and how to borrow, and pricing, as buyers demand higher yields.
The municipal bond market significantly outperformed Treasuries for the week, boosted by the broader bond-market rally. The 10-year benchmark yield fell nearly 33 basis points, a dramatic move that substantively changed municipal yields and relative-value ratios. The 10-year AAA municipal-to-Treasury ratio tightened to 73.9%, from 78.2% a week earlier and below its 74.7% level a month ago, more than reversing the relative underperformance of the prior several weeks. Still, current borrowing costs have resulted in some deals being postponed or reduced in size. Additionally, only 43% of eligible bonds were refinanced in August, suggesting annual supply may fall short of initial projections, and the fourth-quarter calendar could be meaningfully smaller. A smaller calendar should naturally provide additional price support for municipals, even as inflation, energy prices, and higher-for-longer interest rates determine where the market goes from here.
Trust, estate planning, insurance, and investment products are not a deposit, not FDIC insured, not insured by any federal government agency, not guaranteed, subject to investment risks, including possible loss of the principal amount invested and may go down in value. Any information and research contained herein do not represent a recommendation of investment advice to buy or sell stocks or any financial instrument nor is it intended as an endorsement of any security or investment, and it does not constitute an offer or solicitation to buy or sell any securities or investment services. This content is for informational purposes only and does not constitute legal or tax advice. Please consult your legal or tax advisor for specific guidance tailored to your situation. First Western Trust Bank cannot provide tax advice.

Insights
Week in Review: October 16, 2026
Summary Overview Markets generally ended the week lower as investors focused on the start of earnings season, a further selloff […]
Learn more
How Well Does Your Bank Know You?
Most banks know what accounts you have, how much you deposit, and which transactions you make. But knowing your financial […]
Learn more
Week in Review: October 9, 2026
Summary Overview Markets ended the week mixed with large caps (S&P 500) posting a modest gain while small caps and […]
Learn more
Week in Review: October 2, 2026
Overview Markets finished the week mixed as weaker employment data and more measured Federal Reserve commentary lowered expectations for an […]
Learn more
The Decisions That Become Harder as Wealth Grows
Financial success creates more options. It can provide greater flexibility, open new opportunities, and allow you to support the people […]
Learn more
Ready to learn more?
Let’s have a conversation.
Embark on a banking experience tailored to your distinct path, focused on achieving personal and business financial prosperity.